
Is tech bouncing back?
- Jun 9, 2022
- 2 min read
Welcome to Thursday, everyone! We hope this week has treated you well as our trade ideas from Monday have started to hit with a 3% short on $NVDA and longer-term swing trade on $MTN finally turning around - remember to trade with a stop-loss and re-evaluate your positions as new information is made public, read on for more market inspiration!
“If I had asked the public what they wanted, they would have said a faster horse.“ - Henry Ford
Market Talk
The market has really been quite the crucible as of recent with buyers struggling, but managing to hold above the S&P 500’s key 4000 point psychological level since rallying back above it for the second time a week ago today. That said, the market’s fear gauge - the $VIX, (which measures the volatility of the S&P 500 based on the price fluctuations of its options chain. Read more about how it works here) has returned from its highs of the mid-30s.
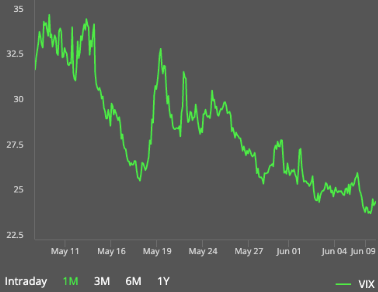
The market would be in really good shape if it was ideally under the 20-point price level, which looks likely given the trend and relative lack of risk-off catalysts within the market in the short term.
Long: AT&T Inc. (T:NYSE) | Timeline: 3-5 days

AT&T Inc, as we all probably know by now, provides telecommunications, media, and technology services worldwide. Over the last few months, a multitude of macroeconomic challenges have driven investors towards value instead of growth, resulting in a tech-sector beat down. However, back in April, the company had finally completed its merger with WarnerBros (WBD) as they look to further streamline their operations, triggering a rebound as investors begin to flock. Taking a look at the chart, bulls have fully taken charge as the 50-ma has crossed above the 200-ma, signalling a golden cross while the RSI has consistently stayed in bullish territory (above 50). Another bullish signal that gives investors strength and confidence at this price range is a symmetrical triangle the stock is currently playing out - a pattern that many traders use in conjunction with other forms of technical analysis that act as trend confirmation.
Chart of the Day - Italy’s 10-Year Treasury Bond Yield since 2019…

Comments